Risk by Score Dashboard
The Risk by Score Dashboard provides a score-based view of your selected Portfolio’s performance. Define the entire dashboard by selecting a score from the View Portfolio Risk By drop-down.
Key Data Elements Panel
The Key Data Elements panel provides score-specific information pertaining to the companies held in your portfolio including the following:
Companies in Portfolio Represents the count of unique D-U-N-S Numbers in your Portfolio as a result of you deciding to Track Companies or Bulk Upload companies. |
Average Score Today Represents the average score of all the companies within your selected Portfolio. The score change in the last 30 days is also displayed under the current average score. You can choose which score defines the entire dashboard. |
Riskiest Companies Represents the count of companies that are either considered Severe or High Risk for the score selected to define the entire dashboard. |
New Riskiest Companies Represents the count of new companies added to the category in the last 30 days. |
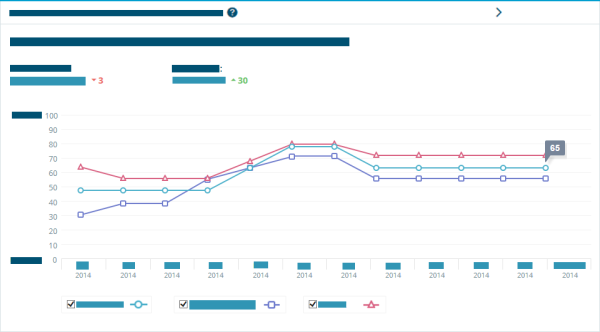
Average Score Trend for Selected Portfolio Panel
The Average Score Trend panel displays the current average score and the prior 11-month average scores for the Selected Portfolio.
The following tags display:
- Tag with the Largest Decline in Average Score (based on the largest decline of a tag from the current average score to the prior 1, 3, 6, or 12-month average scores)
- Tag with the Lowest Current Average Score
- Any two additional Tags that you select to compare
NOTE: The historical view reflects the companies that are currently in the Selected Portfolio., so the number of companies represented will be the same for each month. This does not reflect the companies that are no longer tracked in the Selected Portfolio.
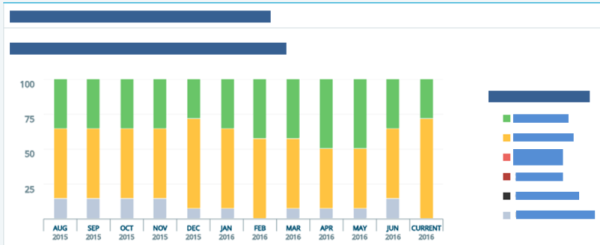
Failure Risk Distribution Trend for Selected Portfolio Panel
The Failure Risk Distribution Trend for Selected Portfolio panel consists of the current and prior 11-month risk distribution based on the score that was selected to define the dashboard:
- Failure Risk
- Severe Delinquency Risk
- Slow Payment Risk (PAYDEX®)
You can hover over each risk segment within the trend chart to get more details regarding the Portfolio:
- Type of risk
- Level of risk
- Number of companies in the risk segment
- Percentage of the selected Portfolio within the risk segment
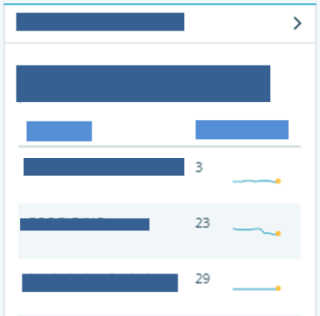
Highest Risk Companies Panel
The Highest Risk Company panel shows you up to ten companies in your selected Portfolio with the lowest current score. For each company, the panel includes the current score and a 12-month sparkline with the end reflecting the color of the current score risk level.
Click on the title and follow the link to the By Company page to see the companies that fit the lowest score criteria.
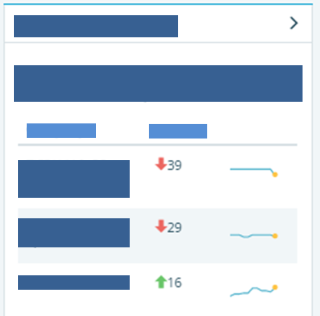
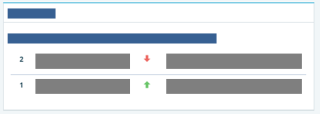
Biggest Score Changes Panel
The Biggest Score Change panel shows you up to ten companies in your selected Portfolio with the most significant change (decline or improvement) between the current score and one month prior. For each company, the panel includes the score change and a 12-month sparkline with the end reflecting the color of the current score risk level.
Click on the title and follow the link to the By Company page to see the companies that fit the biggest score change criteria.
Close Watch Panel
The Close Watch panel highlights companies that have scores trending negatively over the prior 1, 3, 6, and 12 months. Since this panel highlights negative trends instead of just one significant decline, the company will need to have at least three declines between the current score and the prior 1, 3, 6, and 12 month scores to be eligible. The panel shows up to ten eligible companies in your selected Portfolio with the greatest overall average score declines.
For Example, Northwest Region Tag would be included in Close Watch, whereas Southern Region Tag would not due to having two declines.

For each company, the panel includes the score change and a 12-month sparkline with the end reflecting the color of the current score risk level.
Click on the title and follow the link to the By Company page to see the companies that fit the negatively trending criteria.
Risk Shifts Panel
The Risk Shift panel shows you any significant positive or negative risk level changes within your Selected Portfolio for one month prior. Click on the numbers and follow the link to the By Company page to see the companies that shifted to the new risk level.
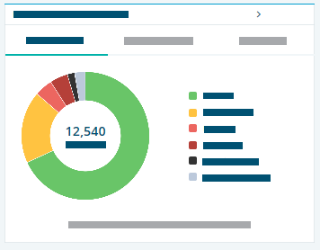
Risk Distribution
The Risk Distribution panel consists of a donut ring that represents a type of score-based risk that is based on the score selected to define the dashboard:
- Failure Risk
- Severe Delinquency Risk
- Slow Payment Risk (PAYDEX®)
The donut ring breaks the selected Portfolio into the following risk segments:
- Low Risk
- Moderate Risk
- High Risk
- Severe Risk
- Companies display signs of significant business deterioration, have filed for bankruptcy, are considered insolvent, have shown characteristics of misrepresentation, or other severely negative behavior.
- Undetermined Risk
- Companies are not able to be assessed due to their lack of information, industry classification (e.g. government entities) or other data limiting issues.
Out of Business
Click on the risk segments and follow the link to the By Company page to see the companies that made up the number. For example, if you want to see all companies that are classified as low Failure Risk score, click on the green portion of the donut.
- © Dun & Bradstreet, Inc. 2019 – 2026. All rights reserved.