Financials Chapter
The Financials Chapter displays a company’s performance and stability data that can be critical when determining credit limits and lending terms. Use this section to access public company financial statements, as well as, the most complete listing of private company financial statements available anywhere.
The following financial information will display: Financial Statement Comparison Graph, Statement Comparison Table, Latest Financial Statement, Statement Information, and Key Business Ratios.
Financial Statement Comparison Panel
The Financial Comparison panel displays a financial statement of a company with important trend data to aid decision making. A comparison of a company's financial statements is provided through a Statement Comparison Graph and Statement Comparison Table.
When you compare two or more successive financial statements of the same concern, a trend becomes apparent. Individual items of the balance sheet and profit and loss statement, compared with identical items on previous statements, can be significantly revealing in decision making. Comparative analysis of a company's financial statement, to its previous results and to industry averages, is essential in assessing its financial health.
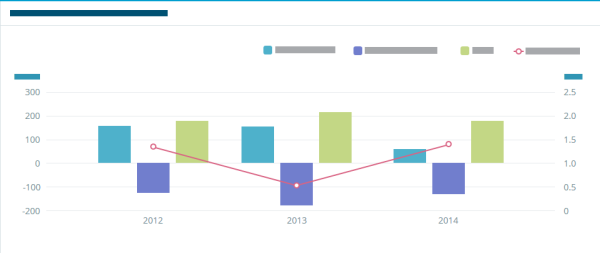
Statement Comparison Graph
The Statement Comparison graph displays a graphical representation of a company's financial statements for the past three years where the graph's set up is as follows: Left Y axis represents Current Liabilities, Current Assets, and Sales. Right Y axis represents the Current Ratio, and the X axis represents the time scale. The body of the graph displays a bar chart of Current Liabilities, Current Assets, Sales, and a trend line to show the Current Ratio using the data available for a company.
Statement Comparison Table
The Statement Comparison Table displays a company's financial statements data in a table, constructed with the following attributes: Total Current Assets, Total Current Liabilities, Total Assets, Total Liabilities, Total Long Term Debt, Tangible Net Worth, Repossession, Sales, and Net Income after Tax.
Latest Financial Statement Panel
The Latest Financial Statement panel displays a company's most recent financial statements such as the Balance Sheet, Profit & Loss, Net worth Reconciliation, Source Information, Audit Information, Interview, and Commentary.
Balance Sheet
The Balance Sheet reports the assets, liabilities, and net worth of a company at a specific point in time.
Assets represent the total resources of a company, which may shrink or increase depending on the results of operations. Assets are listed in liquidity order (ease of converting into cash). Assets include Cash, Accounts Receivable, Inventory, Fixed Assets, and miscellaneous Other. Liabilities include Accounts and Notes Payable, Bank Loans, Deferred Credits, and miscellaneous Other. All businesses divide assets and liabilities into two groups: Current (convertible to cash within a year) and Non-current. Net worth is the owner's investment (in the case of a proprietorship or partnership) or capital stock (original investment) plus earned surplus (earnings retained in the business) in the case of a corporation.
Profit & Loss
The Profit & Loss statement is a detailed computation of the money a business makes or loses over a specific time period. Sales or service income is offset against expenses (operating and production costs). You will most often see year-end statements reflecting income and expenses for a particular calendar year.
Net Worth Reconciliation
Net Worth Reconciliation is the accounting of business deals that increase or decrease the net worth.
Statement Information
Statement information displays where the financial data provided was obtained, through Source Information, Audit Information, Interview Information, and Commentary Information. A company may also add comments on this section to provide an explanation about certain financial statement items.
Key Business Ratios
Key Business Ratios displays a company's financial ratio analysis with the following: Profitability, Short-Term Solvency, Efficiency, and Utilization.
When a banker, credit manager, or investor receives financial information, they conduct a ratio analysis. Ratios are a means of highlighting relationships between financial statement items. There are many ratios which can be complied on any business. Generally, ratios are used for internal analysis of items in a balance sheet; and/or for comparative analysis of a company's ratios at different time periods and in comparison to other firms in the same industry.
- © Dun & Bradstreet, Inc. 2019 – 2026. All rights reserved.