Introducing Your Portfolio
Understanding the failure risk and payment performance of companies when managing a large portfolio can be challenging. Start Tracking a Company in your Portfolio to view various Portfolio content including tables, charts, and graphs that can assist you in easily identifying companies that may be the riskiest or best opportunities. The trends and analytical insights across your Portfolio can highlight:
- Very low risk companies for upsell/growth opportunities.
- Companies that carry a risk of slow or severely delinquent payments requiring tighter credit policies.
- Companies that have a high risk of failing so you can take action to mitigate the potential of bad debt.
Portfolio views will include average scores for the entire selected portfolio or specific segments that have been defined by tags. Your Selected Portfolio will display a different risk level than what is found in the credit report for a company. A risk level mapping from the Credit Report to your Selected Portfolio is as follows:

All of D&B’s data is Quality Assured by the DUNSRight™ process to ensure that it is accurate, complete, timely, and cross-border consistent.
Tracking a Company
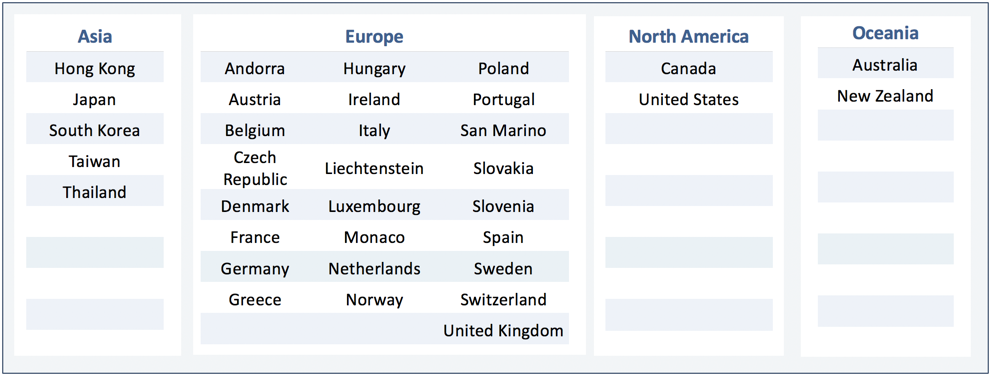
Your portfolio is a specific set of businesses that your company has chosen to track over time to better understand risk and exposure. You can track companies from the following Countries/Regions:
Each time you pull a report from one of these Countries/Regions, click Track this Company to get Alerts and View Your Portfolio changes.
Uploading Your Portfolio in Bulk
You can provide a file of companies to load in bulk and quickly create a live portfolio. When adding in bulk, specify which tags you want to append to each company to quickly enable personalized portfolio segmentation and alerting. Portfolio management through dashboard views and alerting are available on all companies that can be tracked in the Portfolio.
NOTE: The cost of adding the companies to your portfolio is based on your contract type with D&B Credit.
To bulk upload companies into the Portfolio:
- Select Tools in the top navigation. Then select Data Management, Data Import in the left navigation. The Data Import page displays previously uploaded files, upload statuses, and upload details. (Alternatively, from Portfolio, click Upload Companies to navigate to the Date Import page.)
- Click Import New File.
- Optionally, click Download Template to download the pre-formatted, standardized Excel template. Then populate the template with the companies you wish to upload into the Portfolio. Fill in the D-U-N-S Number and Country/Region Code columns for all companies. If you do not have the D-U-N-S Number, enter the company name and Country/Region code, as well as any other available fields, in order to find a match. Save the file.
NOTE: Please make sure the .csv to upload contains only one populated data sheet. If using the provided template, remove the Instructions and Country Codes sheets prior to uploading the file.
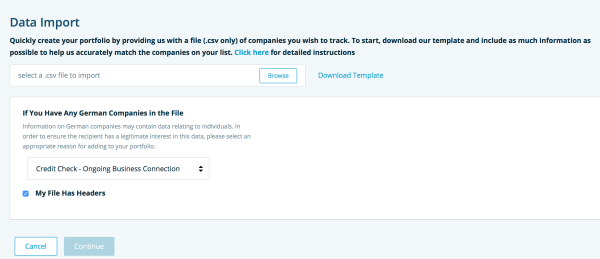
- Click the Browse button and select the file that you wish to upload.
NOTE: Only .csv files are accepted.
- If You Have Any German Companies in the File, select an appropriate reason for adding to your portfolio.
- Optionally, if your file has column headers, select the My File Has Headers checkbox.
- Click Continue. The File Mapping page displays.
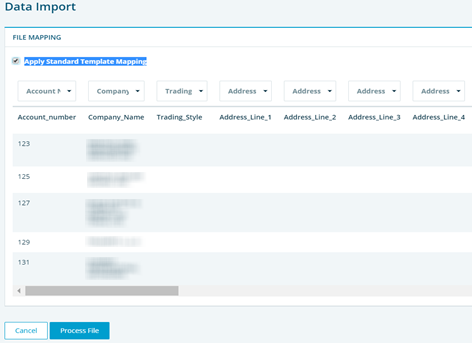
- Select the Apply Standard Template Mapping checkbox to map the fields automatically based on the file layout in the standard template. If not using the standard template, use the drop-down list above each of the columns to select and map each of the columns.
NOTE: This step is crucial as we use the mapped columns to accurately match the companies in your file with those in our database. Company Name or DUNs and Country/Region Code are required mappings. We recommend you provide and map as much qualifying information as possible for an accurate match on a company.
The Process File option is enabled when the mapping is complete. Click Process File to upload the file into the system. Processing takes between 24 and 48 hours. The status of the uploaded file is available from the Data Import page.
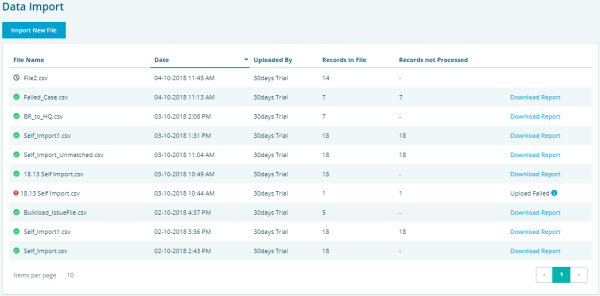
- A green check mark indicates processing is complete. Click Download Report.
NOTE: Other process indicators include the clock (in progress), and the red exclamation (upload failed). For the latter, please check to make sure you have included qualifying information and then upload the updated file.
Stop Tracking a Company
You can modify which companies are included in your Portfolio. Stop tracking a company to remove the company from all Portfolio views and to stop any future alerts for that company. All users that share your workspace will no longer be able to track that company.
To stop tracking an individual company or a group of companies from the Portfolio tab:
- Click By Company on the left navigation panel.
- Select the desired companies.
- Click Stop Tracking.
- Optionally, you can Stop Tracking a company from the Credit Report.
NOTE: The Select All box only refers to the accounts on the current page. If there are multiple pages, you will need to Select All for each page.
Defining Your Portfolio
Your portfolio is a shared set of companies that your business as a whole has chosen to track. Each user is able to define his/her own Portfolio by displaying views of specific companies by creating Tags and Filters.
Tags
Segment your Portfolio with Tags, which allow you to group a set of companies together. You can create your own Tag or use a pre-defined Tag; e.g., Prospect, Pending, Declined, Customer, Supplier, and Watchlist. Tags can be based on geography, product line, customer segments, sales or credit team owner, credit status, etc. To support flexible segmentation, a single company can be in many tags, if required.
Companies in your Portfolio without an assigned tag will be assigned to the Untagged tag by default to ensure the D-U-N-S Numbers are still represented in the Portfolio. Once you assign the company to a tag, the company will be removed from the Untagged tag.
The All Portfolio Companies tag allows Alert Profiles to be assigned to the entire portfolio. You can only apply alert profiles to tags.
Once the Tag has been created, you can attach an existing Alert Profile to ensure you are made aware of any key changes to the companies within the Tag.
You can further segment your Portfolio view to a defined subset of companies by adding Tags to your Filter.
Creating and Editing Tags
To create new Tag(s):
Click Tools.
- Click Create New Tag.
- Enter a Tag name and assign an Alert Profile.
Click Save.
To modify Tag(s):
Click Tools.
- Click Edit for the tag you would like to modify.
- Modify the Tag name and assign a new Alert Profile.
Click Save.
To delete Tag(s):
Click Tools.
Select Tags.
Click Delete.
NOTE: You will only be able to edit Tags that you own or if you are an Admin of the D&B Credit workspace.
Assigning and Using Tags
You can assign a Tag to a company or group of companies.
To assign a Tag to an individual company from the Credit Report:
- Click Add Tags.
- Assign Tag(s) to the company.
Click Save.
- You can also remove tags by deselecting the tag name.
To assign a Tag to a group of company in your Portfolio:
- Select Portfolio in the top navigation.
- Select By Company in the left navigation.
- Filter the list to the companies of interest.
- Click on the largest number of companies per page.
- Click the top box to select all the companies on the page.
- Click the Add Tags button and select the tag name.
- Click Save.
- Go to the next page, then repeat steps 5-7.
Once one or more Tags have been assigned to a company, you may begin to see the Tags in the various Portfolio views; e.g., Score Trend chart in the Risk By Score dashboard. You can also Filter your portfolio by the Tags you have created.
You can remove Tags by deselecting the tag on an individual Credit Report or in bulk on the By Company page.
You can also delete a Tag completely in the Tags section of Tools.
Filters
The filter page displays available filter criteria and a list of filters previously saved by you or others within your company.
NOTE: Any edits to saved filters will change the selected portfolio of all users that have applied the saved filter.
Creating and Saving Filters
To create a saved filter:
Click Tools.
Click Saved Filters.
- Click Create New Filter.
- Enter a Filter name.
Select Tags.
Click Save.
- Optionally, select Filter at the top of any Portfolio page to apply filters.
NOTE: Filter names must be unique within the customer workspace.
Below the Filter Name box, you will see several criteria available to build your query. The pre-set lists will depend on the data elements currently in your Portfolio. If a Country/Region or industry is represented in your Portfolio then it will also be an option within your available criteria.
The default for all criteria is ALL/ANY. Selecting a specific item within a category will deselect the higher category; e.g., if a specific Country/Region is selected, then Any Country/Region is automatically deselected.
Select additional criteria you would like to filter on. Additional criteria includes:
- Tags
- Location
- Industry
- Credit Recommendation
- Risk Categories
Click Save once you complete all of your criteria selections, and your newly-created filter will appear on the saved filters list.
NOTE: Applied criteria is listed at the top of the Portfolio page. Click the X to remove specific criteria from the filter. This will not permanently modify a saved filter.
Applying and Removing Filters
You can edit filters in either the Tools or Portfolio tabs.
From the Tools Tab:
- Select the Saved Filters tab on the left.
- Select the name of the Saved Filter of interest.
Modify the filter conditions.
Click Apply.
From the Portfolio Tab:
- Click Filter at the top of any Portfolio page.
- Select a Saved Filter from the drop-down.
Modify the filter conditions.
Click Apply.
NOTE: Within the quick filter section of Portfolio pages, select filter criteria and click the Apply button without saving the filter.
As the Owner, you can also delete a filter in the Tools Tab.
To delete a filter:
Click Tools.
Click Saved Filters.
- Select the desired filters.
Click Delete.
NOTE: If other users have applied the filter, then their Portfolio view will default back to showing no filter once you delete the saved filter.
Click the X to remove specific criteria or the Clear All Filters button to remove all filters. Neither action permanently modifies a saved filter.
Viewing Your Portfolio
Your Portfolio displays aggregated views of tracked companies designed to show changes over time and to highlight potentially higher risk segments. Your Portfolio also provides lists of companies and Tags within your Portfolio.
NOTE: Views within Portfolio are defined by the applied Filter.
Overview Dashboard
The Overview Dashboard displays your portfolio’s performance. The headline message in red indicates the percentage of companies that fall into the riskiest categories.
NOTE: Credit Advantage users should refer to Managing Accounts Receivable to gain a better understanding of their Portfolio contents.
Key Data Elements Panel
The Key Data Elements panel provides overview information for companies held in your portfolio such as:
Companies in Portfolio Represents the count of unique D-U-N-S Numbers in your Portfolio resulting from a Track Companies or Bulk Upload companies selection. |
Riskiest Companies Represents the companies that fall into one of the following segments:
*ADVANTAGE/PREMIUM EDITION ONLY |
Countries/Regions Represented Represents the count of Countries/Regions in which the list of unique D-U-N-S Numbers is located. |
Industries Represented Represents the count of industries in which the list of unique D-U-N-S Numbers is classified. |
NOTE: Any Key Panel title highlighted in a light blue is clickable and links to the By Company page to display the companies that made up the total number.
Risk Breakdown Panel
The Risk Breakdown panel helps identify the best and worst customers by showing a cross section of your Portfolio based on two different risk events. The y-axis is fixed to show the risk of failure. Use the drop-down to define the second risk type for the x-axis.
When the second risk event is defined, the Risk Breakdown section and Riskiest Company Panel are updated.
The Risk Breakdown provides a Headline Message that displays the percentage of Riskiest Companies currently in your Portfolio and the number of new companies added to this category in that last 30 days.
NOTE: Both the percentage and new number of Riskiest Companies are clickable and link to the By Company page to show companies that made up those numbers.
Two-Dimensional Risk Break Down: Risk Matrix
The two-dimensional matrix displays risk levels for companies in your portfolio based on the selected risk events. The x-axis defaults to Delinquency Risk but can be changed to Slow Payment Risk (based on PAYDEX®). The y-axis defaults to Failure Risk and cannot be changed at this time.
The table is broken into the following risk segments:
- Low Risk
- Moderate Risk
- High Risk
- Severe Risk
- Companies display signs of significant business deterioration, have filed for bankruptcy, are considered insolvent, have shown characteristics of misrepresentation, or other severely negative behavior.
- Undetermined Risk
- Companies are not able to be assessed due to their lack of information, industry classification (e.g. government entities) or other data limiting issues.
- Risk Data Unavailable
- Companies or accounts in your portfolio from countries where there is no live portfolio data available or the selected score is not offered.
- Unmatched*
Accounts that have been imported into D&B Credit that have not been matched to a D-U-N-S.
*ADVANTAGE/PREMIUM EDITION ONLY
Any cells with data is clickable and link to the By Company page to show the companies that made up the number. For example, you can click on the High/High risk cell to get a list of your customers with the worst scores. Cells are left blank with no risk coloring if there are no companies that can be applied to the score combination.
The Riskiest Portion of the Portfolio is highlighted below the two-dimensional table. The percentage represents the number of companies that fall into the riskiest segment vs the total number of companies in the selected portfolio.
The number of companies that have been added to the Riskiest portion within the last 30 days is also available.
The table view and options for the x-axis will vary depending upon the D&B Credit edition and data elements chosen to be displayed.
Cross Tab Analysis With Aged Debt in Credit Advantage
For Credit Advantage users, the portfolio overview also includes a Cross Tab Analysis that compares failure risk with aged debt.
Click the arrow for more detail on Cross Tab Analysis views and account options.
The Cross Tab Analysis table shows companies and accounts in your portfolio categorized by total amounts owing, failure risk, and aged debt distribution.
Customize this analysis in two ways:
- Swap the Aged Debt Distribution for an alternate risk assessment.
- Change your portfolio view from Total Amount Owing to Count of Companies. This will enable a view of the predicted risk of customers that currently have no outstanding debt.
NOTE: Total Amount Owing and Count of Companies display options are only available for Delinquency Risk, and Slow Payment Risk (PAYDEX) assessments.
The Dashboard displays all accounts, including those matched to D-U-N-S Numbers for which D&B cannot provide data (such as those in China), and unmatched accounts. Listed account types include:
| Account Type | Feature |
|---|---|
| Undetermined Risk | Accounts in your portfolio that are not able to be scored due to an event, insufficient information, industry classification (e.g. government entities) or other data limiting issues. |
| Risk Data Unavailable | Accounts in your portfolio from countries where there is no live portfolio data available or the selected score is not offered. |
| Unmatched Accounts | Accounts that have been imported into D&B Credit that have not been matched to a DUNs. |
The cells in the dashboard can be swapped to view company counts rather than the total amount owing or the table can be reverted to a Risk vs. Risk analysis. It can also be filtered by tags or data. This flexibility allows you to carry out risk and opportunity customer analyses on complete or segmented customer base value or volume. The automated analysis highlights high risk and new high risk per month.
The Riskiest Portion of the Portfolio is highlighted below the two-dimensional table. The percentage represents the Outstanding Amount from accounts that fall into the riskiest segment vs the Total Amount Owing in the selected portfolio. Note: Even if the By Count of Companies view is selected for the Risk vs. Risk analysis, the Riskiest percentage will represent the Outstanding Amount not the Number of Companies.
The number of companies that have been added to the Riskiest portion within the last 30 days is also available with the Amount Owning.
Risk Distribution Panel
The Risk Distribution panel consists of donut rings that represent a certain type of risk:
- Failure Risk
- Severe Delinquency Risk
- Slow Payment Risk (PAYDEX®)
Each ring breaks the selected Portfolio into the following risk segments:
- Low Risk
- Moderate Risk
- High Risk
- Severe Risk
- Companies display signs of significant business deterioration, have filed for bankruptcy, are considered insolvent, have shown characteristics of misrepresentation, or other severely negative behavior.
- Undetermined Risk
- Companies are not able to be assessed due to their lack of information, industry classification (e.g. government entities) or other data limiting issues.
- Risk Data Unavailable
- Companies or accounts in your portfolio from countries where there is no live portfolio data available or the selected score is not offered.
- Unmatched*
Accounts that have been imported into D&B Credit that have not been matched to a D-U-N-S.
*ADVANTAGE/PREMIUM EDITION ONLY
Out of Business
You can hover over each risk segment to get more details regarding the Portfolio:
- Type of risk
- Level of risk
- Number of companies in the risk segment
- Percentage of the selected Portfolio within the risk segment
The title is clickable and links to the By Company page to show your selected portfolio. Each risk segment is also clickable and links to the By Company page to show the companies that made up the number. For example, if you want to see all companies that are classified as low Failure Risk score, click on the green portion of the donut.
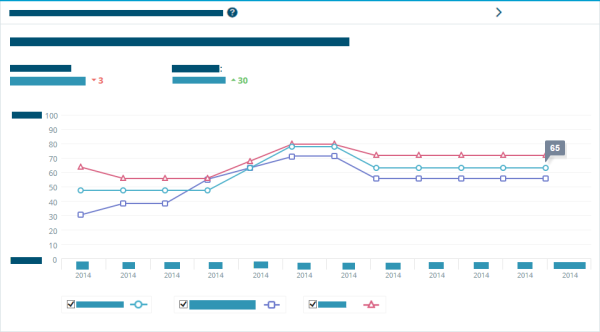
Average Score Trend for Selected Portfolio Panel
The Average Score Trend for the Selected Portfolio panel displays the current average score and prior 11 months for the selected Portfolio. The graph can be filtered to show or hide average scores.
There are two key insights that have been pulled from the trend chart, highlighting the most drastic changes across all scores. The change will be based on any significant changes (decline or improvement) between the current score and 1, 3, 6, or 12 months prior.
The title of the trend chart is clickable and links to the By Company page to show all the companies within your selected Portfolio.
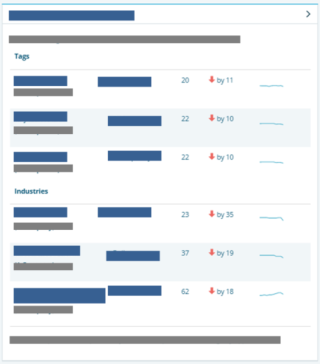
Areas of Interest and Concern Panel
The Areas of Interest and Concern panel displays changes in the average scores for companies in your portfolio by PAYDEX®, Delinquency Score, and Failure Score. You will be notified of the three most significant declines of companies by tags and industry.
Within your selected Portfolio, there may be changes in the average score of a Tag or Industry that are of interest.
The title is clickable and links to the By Company page to show you companies that fit the criteria for significantly declining scores by Tags and Industry. The number of companies for a specific Tag or Industry is also clickable and links to the By Company page to show you the companies that were included in the Tag or Industry.
Recent Alerts Panel
The Recent Alerts panel displays a summary of triggered notifications based on recent changes of companies in your portfolio with the following information: number of Unread Alerts, number of Alerts triggered today, and number of Flagged Alerts. In addition to the Homepage, Credit Report, and Alert Inbox, you can also find a summary of alerts in the Overview Dashboard.
The title is clickable and links to the Alerts Inbox. Click on a specific alert to be taken to the Alert Details page.
Portfolio List
The Portfolio List page allows you to view the full list of companies that make up the aggregated view. You can view your Portfolio list By Tags or By Company.
The Portfolio List By Tag displays a chart with Tag Name, Companies in Tag, Average Failure Score, Average Delinquency Score, and average PAYDEX® of companies with that Tag Name. The scores range from 1-100, with 1 indicating High Risk and 100 indicating Low Risk.
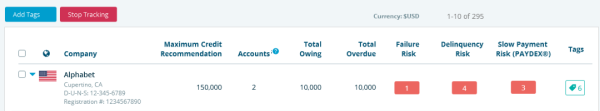
Portfolio By Company
The Portfolio List By Company page provides a risk summary, credit recommendation, and associated tags for each company. The list of companies can be sorted by any of the available columns. The list can display all companies in your portfolio or a subset depending how you navigate to the Company List View.
The header of the page will identify the number of companies that fit the criteria and the actual criteria based on your navigation.
List View with Outstanding Amount in Credit Advantage
For Credit Advantage users, Portfolio List Views show accounts you have associated to a company, along with the total amounts owing and overdue.
Click the arrow for more detail on Accounts within List View.
Each company row with accounts expands to provide a summary view of each account.
The view sorts information by a number of factors, including the following:
- Number of Accounts
- Total Owing
- Total Outstanding
All accounts will display, regardless of whether the account is linked to D-U-N-S Numbers or Unmatched.
- © Dun & Bradstreet, Inc. 2019 – 2026. All rights reserved.