Customer Base Analysis
The Customer Base Analysis (CBA) tool provides the ability to analyze the portfolio or a filtered set of accounts based on three data elements.
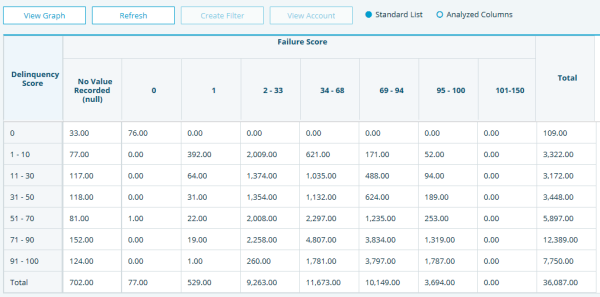
FIGURE 1. Customer Base Analysis Graph
A CBA is great way to do a multi-dimensional analysis of your portfolio with the ability to drill down to a selection of accounts.
Running a CBA
To run a CBA:
- Click the Analysis link in the top navigation bar.
- Select Customer Based Analysis on the left navigation panel.
- Select the analysis name you wish to run from the list.
- Click Run.
Creating a New CBA
To create a new CBA:
- Select +New.
- Enter Analysis Name to define the name of the CBA.
- Choose a field under Analyze(Rows) that will appear in the row headings.
- Choose a field under By(columns) that will appear in the column headings.
- Choose a field under Show Values that will be tabulated (Not Mandatory).
- Select the radio button for the tabulation criteria.
- Select the appropriate number format under Criteria.
- Normal: calculates the data based on the Count, Sum or Average
- Total: shows the percent of the total of all cells
- Row: shows the percent of the total in the row
- Column: show the percent of the total in the column
- Save the CBA. The CBA will now appear on the list.
- Click Run.
NOTE: After the CBA has run, if the option is changed, changes must be saved prior to running the CBA to display the new tabulated figures in the CBA.
NOTE: Available number formats include:
NOTE: The data for the CBA will be cached for 10 days unless the CBA is refreshed.
Editing CBAs
To edit an existing CBA:
- Highlight the CBA and double click.
- Enter the changes.
- Click Save.
Graphing CBAs
To graph CBAs:
- Highlight the cells that should appear in the chart.
- Select View Graph.
To export the graph and data to an Excel file:
- Select Export To File and confirm the transaction to save the graph as a PDF.
- Select Export All To Excel and confirm the transaction to save the graph to Excel.
- Click Open to view the file.
- Select Open to view.
- Select Save As to save the CBA file with a new name.
Refreshing CBAs
To refresh CBAs with the latest data:
- Select Refresh.
Generating Filters
To create a complex filter based on a selection of accounts in the CBA:
Highlight the cells that represent the accounts to filter. To highlight more than one field, hold down the shift key and select the additional fields.
Select Create Filter. A new filter with the CBA name, based on the cells selected will be generated and will appear on the list of filters.
- A new filter with the CBA name, based on the cells selected will be generated and appear on the list of filters.
NOTE: The Total field cannot be included in the selected fields.
Viewing Accounts
A selected list of accounts can be viewed in the Account List for further analysis and information.
To view accounts:
- Highlight the cells that should appear on the Account List.
- Select one of the following radio buttons to specify the Account List viewing option.
- Standard List - which will display the account list in a standard profile
- Analyzed columns - which will display the Account Name and the data for each of the selections that define the rows, columns, and values used to create the CBA
- Select View Account.
- While on the Account list screen to view the D&B or Customer Account detailed information for a specific account, highlight the account and double click.
CBA requests could place intensive demands on system resources. To achieve the quickest possible response time, the initial CBA request, creation date, and results are stored in a cache table. Subsequent requests to RUN the CBA are retrieved from cache unless refreshed or stored results have exceeded the expiration date.
NOTE: Expiration date is based on a maximum age of 10 days for cached records.
- © Dun & Bradstreet, Inc. 2019 – 2026. All rights reserved.