The Company Overview
Basic summary information about companies is available from the Company Overview window.
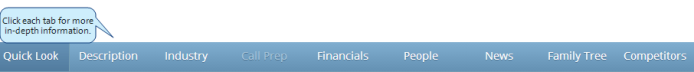
The Company Overview window arranges company information using blue Quick Look tabs that display across the top of the window.
A Company overview window opens to the Quick Look tab, which displays basic summary information about the company as you scroll down. For more information, Viewing the Company Overview Quick Look Tab.
To display more in-depth information, click each of these tabs:
| Tab |
|---|
Quick LookAnnual Sales, Market Value, Employees, Pre Screen Score, and summary information. |
DescriptionA summary description, Operations Data, Financial Analysis summary, Strategy, and Company Background. |
IndustryNAICS Codes and US SIC Codes. |
Call PrepConversation Starters; Operations, Products, and Facilities data; Customers, Marketing, Pricing and Competition information; Regulations, R&D, Imports, & Exports data; Organization & Management information; Financial Analysis summaries; and Business & Technology Strategies data. |
FinancialsCompany Type, Market Value, Annual Sales, Net Income, Basic Financial Information, Current Information, Annual Income Statements, Quarter Income Statement, Top Competitors, Growth Rates, and Comparisons to Industry & Market for Company and for Shares. |
PeoplePeople associated with the company. |
NewsLinks to News and Alerts for this company. |
Family TreeHierarchy, Company, Annual Sales, Employees, and Total Children. |
CompetitorsLists of all competitors for that company and whether they are Top Competitors, Annual Sales, and number of Employees. |
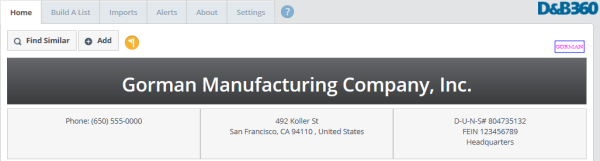
The Quick Look tab displays an overview of what the other tabs provide in more detail. The first row displays:
- Annual Sales and percentage of change for one year
- Current Market Value
- Number of All Employees and percentage of change for one year
- The Pre Screen Score that displays as a level of risk
![]()
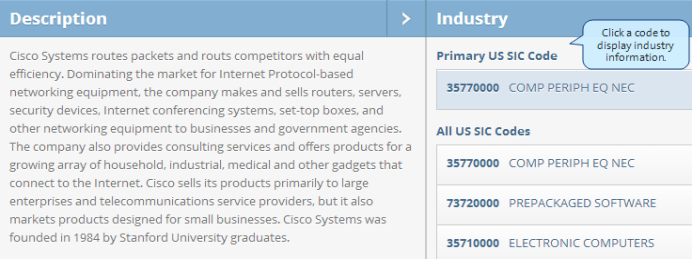
The second row displays a summary Description and Industry information for the company. Click the right arrow for an area to open its tab. Click a US SIC Code or NAICS code to display industry information.
Subsequent rows display the following areas, depending on what information is available for a specific company.
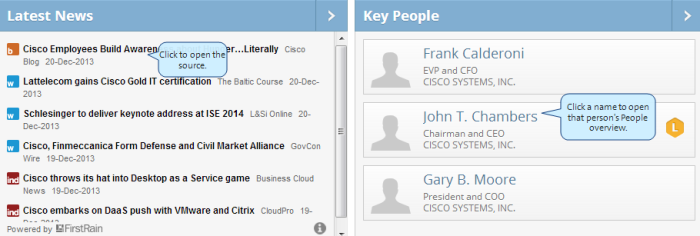
If available for a company, the Latest News and Key People for that company display next. Click the right arrow for an area open its tab. Click a news link to open its source. Click a person's name to open his or her People overview.
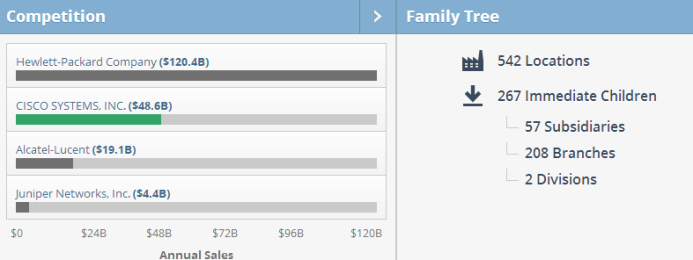
If available for a company, the Competition for that company displays as a bar graph. Family Tree information displays including Locations, Immediate Children, Subsidiaries, Branches, and Divisions. The company data whose window you are viewing displays in green.
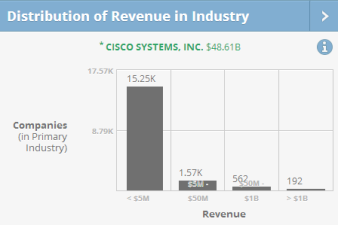
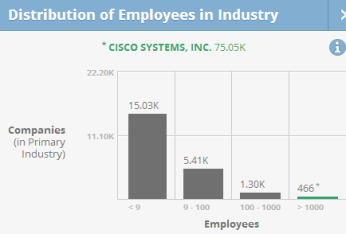
If available for a company, the Distribution of Revenue in Industry and Distribution of Employees in Industry for that company display in bar graph format.
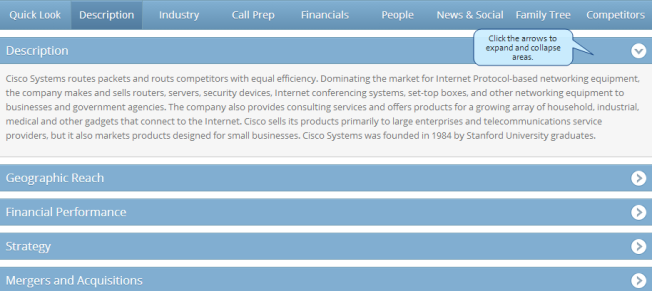
Click the Description tab to display a more in-depth description of the company including a summary description, Operations, Financial Analysis, Strategy, and Company Background. Click the right arrow for an area to open its tab. Click the arrows to expand and collapse each area.
Click the Industry tab to display in-depth industry information about a company including NAICS Codes and US SIC Codes. Click a code to search for Hoovers industries related to that code.
![]()
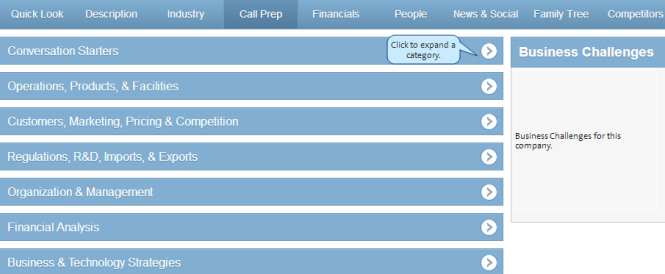
- Click the Call Prep tab to display information that can help prepare you for a sales call:
- Conversation Starters
- Business Challenges
- Operations, Products, & Facilities
- Regulations, R&D, Imports & Exports
- Organization & Management
- Financial Analysis
- Business & Technology Strategies
- Click the right arrow to expand a category.
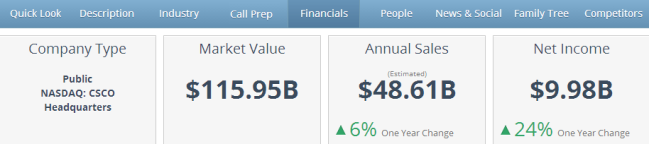
Click the Financials tab to display in-depth financial information about a company.
The first row displays the Company Type, Market Value, Annuals Sales, and Net Income and includes the percentage of change for one year for these values if available.
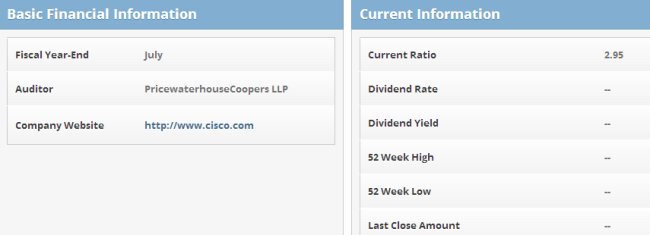
The second row displays Basic Financial Information and Current Information for a company.
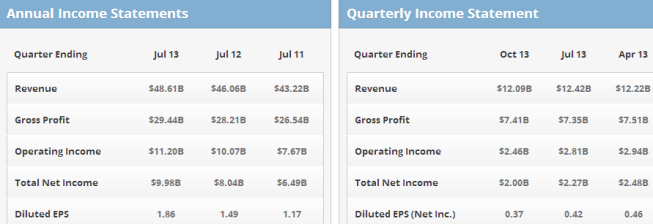
The third row displays Annual Income Statements and the Quarter Income Statement for the company.
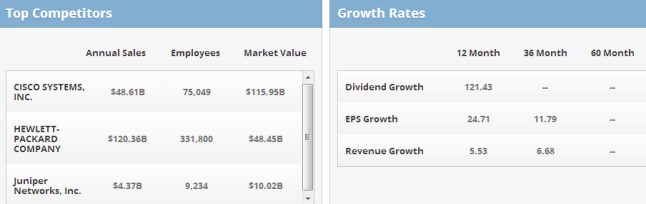
The fourth row displays the company's Top Competitors and Growth Rates.
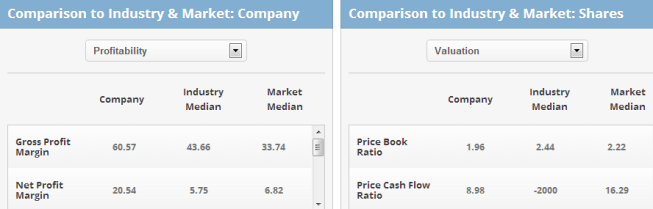
The last row displays Comparison to Industry & Market: Company and Comparison to Industry & Market: Shares.
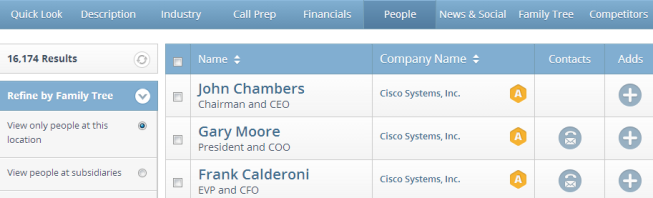
- Click the People tab to display a list of people in a company.
- Use the arrows to sort and filter the results.
- Click the News tab to display related social media information about a company.
- Click the information icon for a description of each area on this window. Use Alerts to track news and create customized alerts targeted to your specific areas of interest. For more information, News Alerts.
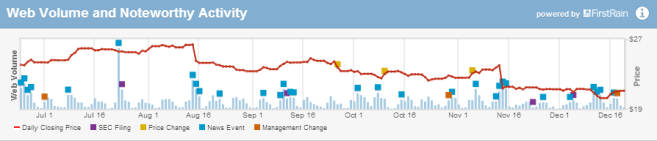
- The top row displays Web Volume and Noteworthy Activity. Hover over a colored square to see more information about an activity, or click a square to open the related SEC web page or related article.
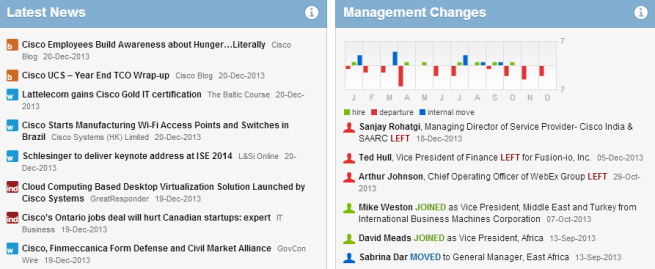
- Next are the Latest News and Management Changes. Click a link to open the source for each news listing or article about a management change.
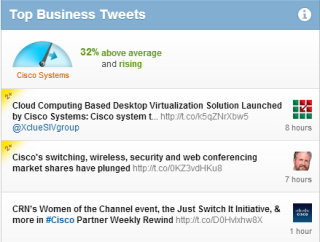
- Next the Event Timeline and Top Business Tweets display. Click an event to open the website about an event. Click a tweet to open the Twitter page for a specific tweet.

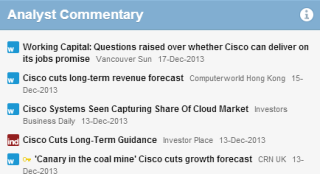
- Finally, Analyst Commentary displays. Click links to open the source for each commentary.
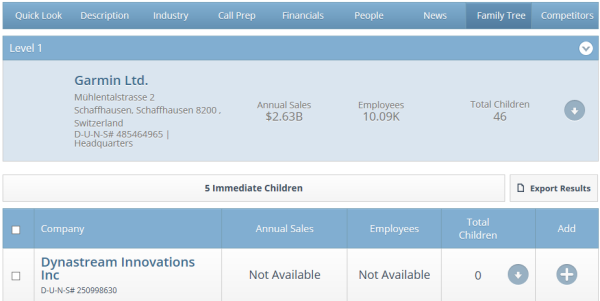
The Company Family Tree tab displays the number children within a family tree. It also allows you to drill down into more depth for the children at different levels.
- Locate and select a company.
- Click the Company Family Tree tab to display family tree information about that company.
- Click the down arrow for any of the children listed in the Family Tree area in order to display additional levels in the Family Tree.
Exporting a Company's Family Tree Information
The entire Family Tree for a company con be exported from the Company Family Tree tab. The export runs offline and the .csv file is sent as an attachment to the email address you provide.
NOTE: The Family Tree export is asynchronous.
- Locate and select a company.
- Click the Company Family Tree tab to display family tree information about that company.
- Click the Export Results button.
- Enter your email address.
- Click Send. The email will contain the .csv file as an attachment.
NOTE: You cannot reply to the email as it is sent from no-reply@dnb360.com. Please check your spam folder if you do not receive the email.
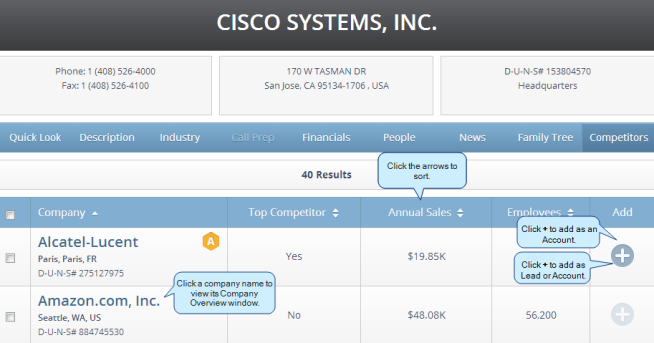
Viewing the Competitor Information for a Company
T1 | T2 | Microsoft | SAP On-Prem | SAP Cloud
Click the Competitors tab to display information about a company's competitors.
- Click the arrows to sort.
- Click a company name to view the Company Overview window for that company.
- Click + to add a listed company as an Account.
- Microsoft Dynamics CRM users can click + to add a listed company as a Lead.
- © Dun & Bradstreet, Inc. 2019 – 2026. All rights reserved.